ANGSD: Analysis of next generation Sequencing Data
Latest tar.gz version is (0.938/0.939 on github), see Change_log for changes, and download it here.
Abbababa
Performs the abbababa test also called the D-statistic. This tests for ancient admixture (or wrong tree topology). As all methods in ANGSD we require that the header of the BAM files are the same.
- some of the options only works for the develupmental version availeble from github
- if you use -rf to specify regions. These MUST appear in the same ordering as your fai file.
<classdiagram type="dir:LR">
[BAM files{bg:orange}]->[Sequence data|Random base]
[sequence data]->[*.abbababa|ABBA and BABA couts file{bg:blue}] </classdiagram>
<classdiagram type="dir:LR">
[*.abbababa|ABBA and BABA couts file{bg:blue}]->jackKnife.R[D stat and Z scores{bg:blue}]
</classdiagram>
Method
Brief Overview
> ./angsd -doAbbababa

--------------
abcDstat.cpp:
	-doAbbababa		0	run the abbababa analysis
	-rmTrans		0	remove transitions
	-blockSize		5000000	size of each block in bases
	-enhance		0	outgroup must have same base for all reads
	-ans			(null)	fasta file with outgroup
	-useLast		0	use the last individuals as outgroup instead of -anc
This function will counts the number of ABBA and BABA sites
Options
- -doAbbababa 1
- sample a random base at each position.
- -rmTrans [int]
0; use all reads (default), 1 Remove transitions (important for ancient DNA)
- -blockSize [INT]
Size of each block. Choose a number that is higher than the LD in the populations. For human 5Mb (5000000) is usually used.
- -anc [fileName.fa]
Include an outgroup in fasta format.
- -doCounts 1
use -doCounts 1 in order to count the bases at each sites after filters.
- -useLast [int]
1: use the last individual in the bam file list as outgroup instead of a fasta file (-anc)
- -enhance [int]
1: use only sites where the reads for the outgroup has the same base for all reads. Only works with -useLast 1
In order to do fancy filtering of bases based on quality scores see the Allele counts options.
Output
- .abbbababa
Output: Each lines represents a block with a chromsome name (Column 1), a start position (Column 2), an end postion (Column 3). The new columns are the counts of ABBA and BABA sites. For each combination of 3 individuals (H1,H2,H3) two columns are printed. These number served as input to the R script called jackKnife.R. This script will skip combinations of individuals if there is less than 3 blocks with data. Type "Rscript R/jackKnife.R" to see additional options.
Example
Create a fasta file bases from a random samples of bases.
# select 5 individuals
head -n5 bam.filelist > smallBam.filelist

#run angsd
./angsd -out out -doAbbababa 1 -bam smallBam.filelist -doCounts 1 -anc chimpHG19.fa

#estimate Z score
Rscript R/jackKnife.R file=out.abbababa indNames=smallBam.filelist outfile=out
This results in a out.txt file with all the results.
Output
H1	H2	H3	 nABBA	nBABA	Dstat	jackEst	SE	Z
NA11830	NA12004	NA12763	269	322	-0.08967851	-0.08967851	0.09006086	-0.9957545
NA11830	NA06985	NA12763	267	298	-0.05486726	-0.05486726	0.122256	-0.4487898
NA12004	NA06985	NA12763	254	243	0.0221328	0.0221328	0.1386198	0.1596655
NA11830	NA11993	NA12763	225	336	-0.197861	-0.197861	0.08514797	-2.323731
NA12004	NA11993	NA12763	217	267	-0.1033058	-0.1033058	0.09471542	-1.090697
NA06985	NA11993	NA12763	242	302	-0.1102941	-0.1102941	0.1241554	-0.8883553
NA12763	NA12004	NA11830	237	322	-0.1520572	-0.1520572	0.1047361	-1.451813
NA12763	NA06985	NA11830	219	298	-0.1528046	-0.1528046	0.1115283	-1.370098
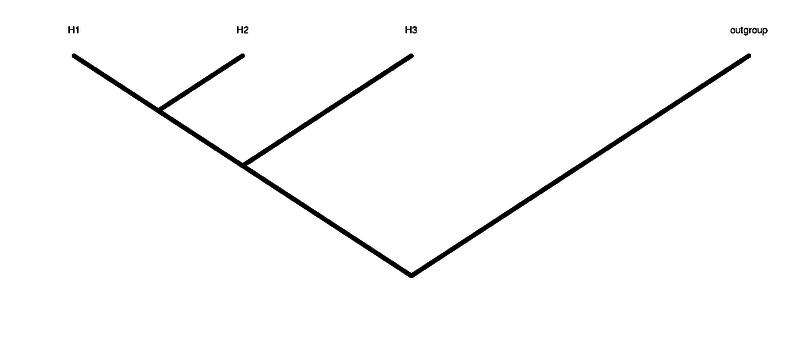
H1 H2 H3 are the 3 individuals in the tree that are not the outgroup. H1 and H2 are the ingroup (see figure of tree above)
nABBA the total counts of ABBA patterns
nBABA the total counts of BABA patterns
Dstat The test statistic: (nABBA-nBABA)/(nABBA+nBABA). A negative value means that H1 is closer to H3 than H2 is. A positive value means that H2 is closer to H3 than H1 is.
JackEst column is another estimate of the abbababa statistic that is bias corrected. This value is extremely similar to the value in the Dstat column
SE is the estimated m-delete blocked Jackknife Standard error of the estimate used to obtain the Z value
Z Z value that can be used to determine the significance of the test. As in Reich et al. an absolute value of the Z score above 3 is often used as a critical value. However, this note that this does not take into account the fact that we perform multiple tests.
