ANGSD: Analysis of next generation Sequencing Data
Latest tar.gz version is (0.938/0.939 on github), see Change_log for changes, and download it here.
Safv3
We decided to update the native simple binary double format to a much more intelligent format that allows for random access. The format is described in doc/formats.pdf.
This page will contain the impact of this new format in downstream analysis.
NB the ml estimate from realSFS is now expectations of the sfs, and not in logscale. So the exp commands in the code belove is deprecated.
One population analysis
#old master
angsd version: 0.801-27-ga699b44 (htslib: 1.2.1-62-g35746af) build(May  5 2015 03:38:17)
#new new saf
angsd version: 0.801-54-gcf1a12d-dirty (htslib: 1.2.1-62-g35746af) build(May  6 2015 23:34:27)

##old
../master/angsd -anc hg19ancNoChr.fa -dosaf 1 -b /space/genomes/1000g/lowC2014/filelists/ceu.ricco.list -gl 1 -P 5 -out oldceu -rf rf
../master/misc/realSFS oldceu.saf 36 -nSites 213376207 -P 20 >oldceu.saf.ml

##new
../angsd/angsd -anc hg19ancNoChr.fa -dosaf 1 -b /space/genomes/1000g/lowC2014/filelists/ceu.ricco.list -gl 1 -P 5 -out newceu -rf rf
../angsd/misc/realSFS ../nsfs/newceu.saf.idx -P 16 -r 1 >ceu.chr1

##comparison
a<-scan("newceu.saf.idx.chr1.ml")
b<-as.numeric(read.table("oldceu.saf.ml")[1,])
a-b
 [1]  0.000000e+00  0.000000e+00  0.000000e+00  0.000000e+00  0.000000e+00
 [6]  0.000000e+00  0.000000e+00 -1.248518e-10  4.059244e-10 -3.843052e-10
[11]  4.952888e-10 -2.465176e-10  7.169737e-11  0.000000e+00  0.000000e+00
[16]  0.000000e+00  0.000000e+00 -4.288667e-11  0.000000e+00  0.000000e+00
[21]  0.000000e+00  0.000000e+00  0.000000e+00  0.000000e+00  0.000000e+00
[26]  0.000000e+00  0.000000e+00  0.000000e+00  0.000000e+00  0.000000e+00
[31]  0.000000e+00  0.000000e+00  0.000000e+00  0.000000e+00  0.000000e+00
[36]  0.000000e+00  0.000000e+00
range(a-b)
[1] -3.843052e-10  4.952888e-10
 barplot(rbind(a,b)[,-c(1,37)],be=T,legend=c("new","old"),col=1:2)
Two population analysis
##old(master)	-> angsd version: 0.801-28-gbab908a (htslib: 1.2.1-62-g35746af) build(May  9 2015 14:50:33)
##new(newsaf)-> angsd version: 0.801-61-g48f06d8-dirty (htslib: 1.2.1-62-g35746af) build(May  9 2015 08:49:40)
##old version required a run for each population, to find the intersect and then limit the analysis to the intersect.
##Here are all 4 commands
==> oldceu2.arg <==
../master/angsd -anc hg19ancNoChr.fa -dosaf 1 -b /space/genomes/1000g/lowC2014/filelists/ceu.ricco.list -gl 1 -P 5 -out oldceu2 -r 1 -sites intersect.txt
==> oldceu.arg <==
../angsd/angsd -anc hg19ancNoChr.fa -dosaf 1 -b /space/genomes/1000g/lowC2014/filelists/ceu.ricco.list -gl 1 -P 5 -out oldceu -r 1
==> oldyri2.arg <==
../master/angsd -anc hg19ancNoChr.fa -dosaf 1 -b /space/genomes/1000g/lowC2014/filelists/yri.ricco.list -gl 1 -P 5 -out oldyri2 -r 1 -sites intersect.txt
==> oldyri.arg <==
../angsd/angsd -anc hg19ancNoChr.fa -dosaf 1 -b /space/genomes/1000g/lowC2014/filelists/yri.ricco.list -gl 1 -P 5 -out oldyri -r 1


##with intersect found like
gunzip -c oldceu.saf.pos.gz oldyri.saf.pos.gz|sort  -S 50%|uniq -d|sort -k1,1  -S 50% >intersect.txt


##The old saf files are very big so we had to limit the analysis to 100mio sites
../master/misc/realSFS 2dsfs oldceu2.saf oldyri2.saf 36 52 -nSites 100000000 -P 20 >oldceu2.oldyri2.ml.100mb

##the new format is much simpler here we simply did
==> newceu.arg <==
../angsd/angsd -anc hg19ancNoChr.fa -dosaf 1 -b /space/genomes/1000g/lowC2014/filelists/ceu.ricco.list -gl 1 -P 5 -out newceu -r 1
==> newyri.arg <==
../angsd/angsd -anc hg19ancNoChr.fa -dosaf 1 -b /space/genomes/1000g/lowC2014/filelists/yri.ricco.list -gl 1 -P 5 -out newyri -r 1

../angsd/misc/realSFS ../nsfs/newceu.saf.idx ../nsfs/newyri.saf.idx -P 32 -r 1 -nSites 100000000 >ceu.yri.chr1.100mb
and comparing in R
norm<-function(X) X/sum(X)
a<-read.table("oldceu2.oldyri2.100mb",nrow=37)
b<-norm(scan("newceu.newyri.chr1.100mb"))
b<-matrix(b,ncol=53,byrow=T)
> range(a-b)
[1] -1.724603e-07  2.850303e-09

> png("safv3to.png")
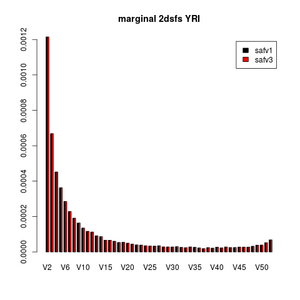
> barplot(rbind(colSums(a),colSums(b))[,-c(1,53)],be=T,main="marginal 2dsfs YRI",legend=c("safv1","safv3"),col=1:2)
> dev.off()
X11cairo
       2
> png("safv3en.png")
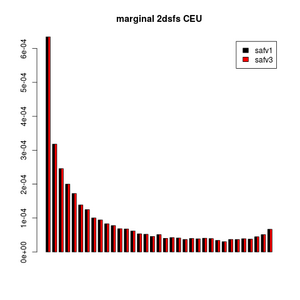
> barplot(rbind(rowSums(a),rowSums(b))[,-c(1,37)],be=T,main="marginal 2dsfs CEU",legend=c("safv1","safv3"),col=1:2)
> dev.off()


This looks very nice, right?
2 population analysis with simulated data
After doing this analysis I noticed that I had put a zero too much on the -reglen option for the simulated data with invariable sites. And still the method works fine. The result is that we still find the sfs nicely eventhough we only have 1/10 of the variability that we would expect from human data. So this is very good.
##angsd new: 	->-> angsd version: 0.801-51-g156039a (htslib: 1.2.1-69-gb79f40a) build(May  7 2015 15:31:53)
##angsd old: 	-> angsd version: 0.801-27-ga699b44 (htslib: 1.2.1-69-gb79f40a) build(May  7 2015 15:30:06)

norm <- function(x) x/sum(x)
if(FALSE){
  ##generate data DONT RUN
   if(FALSE){
       ##simulate data with msms
       nRep <- 10
       nPop1 <- 24
       nPop2 <- 16
       cmd <- paste("msms -ms",nPop1+nPop2,nRep,"-t 930 -r 400 -I 2",nPop1,nPop2,"0 -g 1 9.70406 -n 1 2 -n 2 1 -ma x 0.0 0.0 x -ej 0.07142857 2 1  >msoutput.txt ",sep=" ")
       system(cmd)
       ##system("msms -ms 40 1 -t 930 -r 400 -I 2 20 20 0 -g 1 9.70406 -n 1 2 -n 2 1 -ma x 0.0 0.0 x -ej 0.07142857 2 1  >msoutput.txt  ")

       source("readms.output.R")
   }
   if(FALSE){
       ##use R to calculate SFS for each pop and 2dsfs
       source("../R/readms.output.R")
       a<- read.ms.output(file="msoutput.txt")

       p1.d <- unlist((sapply(a$gam,function(x) colSums(x[1:nPop1,]))))
       p2.d <- unlist((sapply(a$gam,function(x) colSums(x[-c(1:nPop1),]))))
       par(mfrow=c(1,2))
       barplot(table(p1.d))
       barplot(table(p2.d))

       sfs.2d <- sapply(0:nPop1,function(x) table(factor(p2.d[p1.d==x],levels=0:nPop2)))
   }
   if(FALSE){
       ##generate ANGSD inputfiles without invariable sites and run it
       system("../misc/msToGlf -in msoutput.txt -out raw -singleOut 1 -regLen 0 -depth 8 -err 0.005")
       system("../misc/splitgl raw.glf.gz 20 1 12 >pop1.glf.gz")
       system("../misc/splitgl raw.glf.gz 20 13 20 >pop2.glf.gz")
       system("echo \"1 250000000\" >fai.fai")
       system("../angsd -glf pop1.glf.gz -nind 12 -doSaf 1 -out pop1 -fai fai.fai -issim 1")
       system("../angsd -glf pop2.glf.gz -nind 8 -doSaf 1 -out pop2 -fai fai.fai -issim 1")
       system("../misc/realSFS pop1.saf.idx >pop1.saf.idx.ml")
       system("../misc/realSFS pop2.saf.idx >pop2.saf.idx.ml")
       system("../misc/realSFS pop1.saf.idx pop2.saf.idx >pop1.pop2.saf.idx.ml")
   }
   if(FALSE){
       pop1 <- scan("pop1.saf.idx.ml")
       pop2 <- scan("pop2.saf.idx.ml")
       pop1.pop2 <- matrix(exp(scan("pop1.pop2.saf.idx.ml")),nPop1+1,byrow=T)
       par(mfrow=c(1,2))
       barplot(rbind(norm(table(p1.d)),pop1),be=T,main="only varsites pop1")
       barplot(rbind(norm(table(p2.d)),pop2),be=T,main="only varsites pop2")
       range(norm(sfs.2d)-t(pop1.pop2))
       ##[1] -0.0005150658  0.0004685074

       barplot(rbind(rowSums(norm(t(sfs.2d))),rowSums(pop1.pop2)),be=T)
       barplot(rbind(colSums(norm(t(sfs.2d))),colSums(pop1.pop2)),be=T)

   }
   if(FALSE){
       ##simulate angsd inputfiles with invariable sites and run it
       system("../misc/msToGlf -in msoutput.txt -out raw -singleOut 1 -regLen 10000000 -depth 8 -err 0.005")
       system("../misc/splitgl raw.glf.gz 20 1 12 >pop1.glf.gz")
       system("../misc/splitgl raw.glf.gz 20 13 20 >pop2.glf.gz")
       system("echo \"1 250000000\" >fai.fai")
       system("../angsd -glf pop1.glf.gz -nind 12 -doSaf 1 -out pop1 -fai fai.fai -issim 1")
       system("../angsd -glf pop2.glf.gz -nind 8 -doSaf 1 -out pop2 -fai fai.fai -issim 1")
       system("../misc/realSFS pop1.saf.idx >pop1.saf.idx.ml")
       system("../misc/realSFS pop2.saf.idx >pop2.saf.idx.ml")
       system("../misc/realSFS pop1.saf.idx pop2.saf.idx >pop1.pop2.saf.idx.ml")

   }
   if(FALSE){
       pop1 <- norm(exp(scan("pop1.saf.idx.ml"))[-1])
       pop2 <- norm(exp(scan("pop2.saf.idx.ml"))[-1])
       pop1.pop2 <- matrix(exp(scan("pop1.pop2.saf.idx.ml")),nPop1+1,byrow=T)
       par(mfrow=c(1,2))
       barplot(rbind(norm(table(p1.d)[-1]),pop1),be=T,main="varsites pop1")
       barplot(rbind(norm(table(p2.d)[-1]),pop2),be=T,main="varsites pop2")
       pop1.pop2[1,1] <- 0
       pop1.pop2[nrow(pop1.pop2),ncol(pop1.pop2)] <- 0
       pop1.pop2 <- norm(pop1.pop2)
       range(norm(sfs.2d)-t(pop1.pop2))
#[1] -0.0005047007  0.0007018686

       barplot(rbind(rowSums(norm(t(sfs.2d))),rowSums(pop1.pop2)),be=T)
       barplot(rbind(colSums(norm(t(sfs.2d))),colSums(pop1.pop2)),be=T)

   }
   if(FALSE){
       ##just redo the angsd and optimization
       ##git checkout master ;make clean;make
       system("../angsd -glf pop1.glf.gz -nind 12 -doSaf 1 -out pop1 -fai fai.fai -issim 1 -P 10")
       system("../angsd -glf pop2.glf.gz -nind 8 -doSaf 1 -out pop2 -fai fai.fai -issim 1 -P 10")
       system("../misc/realSFS pop1.saf 24 -P 60 >pop1.saf.idx.ml")
       system("../misc/realSFS pop2.saf 16 -P 60 >pop2.saf.idx.ml")
       system("../misc/realSFS 2dsfs pop1.saf pop2.saf 24 16 -P 60 >pop1.pop2.saf.idx.ml")
   }
   if(FALSE){
       pop1 <- norm(exp(scan("pop1.saf.idx.ml"))[-1])
       pop2 <- norm(exp(scan("pop2.saf.idx.ml"))[-1])
       pop1.pop2 <- matrix(exp(scan("pop1.pop2.saf.idx.ml")),nPop1+1,byrow=T)
       par(mfrow=c(1,2))
       barplot(rbind(norm(table(p1.d)[-1]),pop1),be=T,main="varsites pop1")
       barplot(rbind(norm(table(p2.d)[-1]),pop2),be=T,main="varsites pop2")
       pop1.pop2[1,1] <- 0
       pop1.pop2[nrow(pop1.pop2),ncol(pop1.pop2)] <- 0
       pop1.pop2 <- norm(pop1.pop2)
       range(norm(sfs.2d)-t(pop1.pop2))
       ##       [1] -0.0005046856  0.0007019217

   }

}