ANGSD: Analysis of next generation Sequencing Data
Latest tar.gz version is (0.938/0.939 on github), see Change_log for changes, and download it here.
Tutorial
This tutorial only uses BAMfiles.
Prepare files
angsd can work on remote bam files therefore first download a list with 23 unrelated europeans from the 1000genomes project.
wget http://popgen.dk/netstuff/files.list
Contents of the file 'files.list'
ftp://ftp.1000genomes.ebi.ac.uk/vol1/ftp/data/NA12003/alignment/NA12003.mapped.ILLUMINA.bwa.CEU.low_coverage.20120522.bam
ftp://ftp.1000genomes.ebi.ac.uk/vol1/ftp/data/NA12004/alignment/NA12004.mapped.ILLUMINA.bwa.CEU.low_coverage.20120522.bam
ftp://ftp.1000genomes.ebi.ac.uk/vol1/ftp/data/NA12005/alignment/NA12005.mapped.ILLUMINA.bwa.CEU.low_coverage.20120522.bam
ftp://ftp.1000genomes.ebi.ac.uk/vol1/ftp/data/NA12006/alignment/NA12006.mapped.ILLUMINA.bwa.CEU.low_coverage.20120522.bam
ftp://ftp.1000genomes.ebi.ac.uk/vol1/ftp/data/NA11830/alignment/NA11830.mapped.ILLUMINA.bwa.CEU.low_coverage.20120522.bam
ftp://ftp.1000genomes.ebi.ac.uk/vol1/ftp/data/NA11831/alignment/NA11831.mapped.ILLUMINA.bwa.CEU.low_coverage.20120522.bam
ftp://ftp.1000genomes.ebi.ac.uk/vol1/ftp/data/NA11832/alignment/NA11832.mapped.ILLUMINA.bwa.CEU.low_coverage.20120522.bam
ftp://ftp.1000genomes.ebi.ac.uk/vol1/ftp/data/NA11992/alignment/NA11992.mapped.ILLUMINA.bwa.CEU.low_coverage.20120522.bam
ftp://ftp.1000genomes.ebi.ac.uk/vol1/ftp/data/NA11993/alignment/NA11993.mapped.ILLUMINA.bwa.CEU.low_coverage.20120522.bam
ftp://ftp.1000genomes.ebi.ac.uk/vol1/ftp/data/NA11994/alignment/NA11994.mapped.ILLUMINA.bwa.CEU.low_coverage.20120522.bam
ftp://ftp.1000genomes.ebi.ac.uk/vol1/ftp/data/NA11995/alignment/NA11995.mapped.ILLUMINA.bwa.CEU.low_coverage.20120522.bam
ftp://ftp.1000genomes.ebi.ac.uk/vol1/ftp/data/NA12154/alignment/NA12154.mapped.ILLUMINA.bwa.CEU.low_coverage.20120522.bam
ftp://ftp.1000genomes.ebi.ac.uk/vol1/ftp/data/NA12155/alignment/NA12155.mapped.ILLUMINA.bwa.CEU.low_coverage.20120522.bam
ftp://ftp.1000genomes.ebi.ac.uk/vol1/ftp/data/NA12156/alignment/NA12156.mapped.ILLUMINA.bwa.CEU.low_coverage.20120522.bam
ftp://ftp.1000genomes.ebi.ac.uk/vol1/ftp/data/NA06994/alignment/NA06994.mapped.ILLUMINA.bwa.CEU.low_coverage.20120522.bam
ftp://ftp.1000genomes.ebi.ac.uk/vol1/ftp/data/NA11840/alignment/NA11840.mapped.ILLUMINA.bwa.CEU.low_coverage.20120522.bam
ftp://ftp.1000genomes.ebi.ac.uk/vol1/ftp/data/NA12044/alignment/NA12044.mapped.ILLUMINA.bwa.CEU.low_coverage.20120522.bam
ftp://ftp.1000genomes.ebi.ac.uk/vol1/ftp/data/NA12813/alignment/NA12813.mapped.ILLUMINA.bwa.CEU.low_coverage.20120522.bam
ftp://ftp.1000genomes.ebi.ac.uk/vol1/ftp/data/NA12760/alignment/NA12760.mapped.ILLUMINA.bwa.CEU.low_coverage.20120522.bam
ftp://ftp.1000genomes.ebi.ac.uk/vol1/ftp/data/NA12762/alignment/NA12762.mapped.ILLUMINA.bwa.CEU.low_coverage.20120522.bam
ftp://ftp.1000genomes.ebi.ac.uk/vol1/ftp/data/NA06985/alignment/NA06985.mapped.ILLUMINA.bwa.CEU.low_coverage.20120522.bam
ftp://ftp.1000genomes.ebi.ac.uk/vol1/ftp/data/NA11881/alignment/NA11881.mapped.ILLUMINA.bwa.CEU.low_coverage.20120522.bam
ftp://ftp.1000genomes.ebi.ac.uk/vol1/ftp/data/NA12249/alignment/NA12249.mapped.ILLUMINA.bwa.CEU.low_coverage.20120522.bam
Understaing angsd options
As a simple reference for the program we have made most of the methods within angsd easy viewable by writing the associated command. All options are given by
-parameter value
It's important that there are no space between the dash and the paramater, it is important that there are a space betwwen the parameter and the value. Futhermore the parameter is casesensitive.
Simply writing angsd will give you the helpscreen.
./angsd
Command:
angsd
	-> angsd version: 0.515	 build(Mar 23 2013 12:35:04)
	-> Please use the website "http://www.popgen.dk/angsd" as reference
	-> Use -nThreads for number of threads allocated to the program

Overview of methods:
	-GL		estimate genotype likelihoods
	-doCounts	Calculate various counts statistics
	-doDepth	Do depth statistics
	-doAsso		perform association study
	-doMaf		estimate allele frequencies
	-doError	estimate the type specific error rates
	-doAnsError	estimate the errorrate based on perfect fastas
	-doHWE		Est inbreedning per site
	-doGeno		call genotypes
	-realSFS	Estimate the SFS and/or perform neutrality tests

	Below are options that can be usefull
	-bam		Options relating to bam reading
	-doMajorMinor	Infer the major/minor using different approaches
	-ref/-anc	Read reference or ancestral genome
	many others

For information of specific options type:
	./angsd METHODNAME eg
		./angsd -GL
		./angsd -doMaf
		./angsd -doAsso etc
Examples:
	Estimate MAF for bam files in 'list'
		'./angsd -bam list -GL 2 -doMaf 2 -out RES -doMajorMinor 1'
An explanation for every parameter is shown beside the parameter, and for every of these options we can get additional information by typing that parameter solely without any options. An example below for the methods relating to genotype likelihood calculation.
./angsd -GL
	-> angsd version: 0.515	 build(Mar 27 2013 11:15:58)
	-> Analysis helpbox/synopsis information:
---------------------
analysisEstLikes.cpp:
	-GL=0:
	1: SAMtools
	2: GATK
	3: SOAPsnp
	4: SYK
	-minQ		13		(remove bases with qscore<minQ)
	-trim		0		(zero means no trimming)
	-tmpdir		angsd_tmpdir/	(used by SOAPsnp)
	-errors		(null)		(used by SYK)
	-minInd		-1		(-1 indicates no filtering)

Filedumping:
	-doGlf=0
	1: binary glf (10 log likes)	.glf
	2: beagle likelihood file	.beagle.gz
	3: binary 3 times likelihood	.glf
	4: text version (10 log likes)	.glf
This tells you that there are 4 different genotype likelihood models implemented and you can choose accordingly by writing -GL 1 for the SAMtools model. We also see that we can dump the genotype likelihoods in four different ways.
Understanding angsd output
Program catches system signals, if you press ctrl+c, it will therefore stop the filereading, but will let the threads already running finish their jobs. You can therefore press ctrl+c at anytime at expect to get proper output files. After a run has been completed the program will printout a list of the generated files.
An example is below.
./angsd0.530/angsd -bam files.list -doMaf 2 -out tstMaf -doMajorMinor 1 -GL 1 -nInd 20 -minMaf 0.005 -nThreads 10 -doCounts 1 -dumpCounts 3
Command:
./angsd0.530/angsd -bam files.list -doMaf 2 -out tstMaf -doMajorMinor 1 -GL 1 -nInd 20 -minMaf 0.005 -nThreads 10 -doCounts 1 -dumpCounts 3
	-> angsd version: 0.529	 build(May  2 2013 14:09:03)
	->Starting analysis
[uppile] parsing 20 number of samples
Change of chromo detected Waiting for nThreads:0
	->printing at chr: chr1 pos:3756580 chunknumber 500
^CCaught SIGNAL: 2 will try to exit nicely (no more threads are created, we will wait for the current threads to finish)
SEnding NULL this is a killswitch
	-> Done reading data waiting for calculations to finish
	-> Calling destroy
	-> Waiting for nThreads:9
	-> Waiting for nThreads:3

	-> Done waiting for threads
	->Output filenames:
		->"tstMaf.arg"
		->"tstMaf.pos"
		->"tstMaf.counts"
		->"tstMaf.mafs"

	Thu May  2 15:11:31 2013
	[ALL done] cpu-time used =  77.95 sec
	[ALL done] walltime used =  21.00 sec
Getting simple Counts/depth
For some analysis simply getting the sequencing depth for all sites could be of interest, this can of analysis is grouped in the '-doCounts' methods.
./angsd -doCounts
---------------
analysisCount.cpp:
	-doCounts	0	(Count the number A,C,G,T. All sites, All samples)
	-minQ		13	(remove bases with qscore<minQ)
	-setMaxDepth	-1	(-1 indicates no filtering)
	-trim		0	(trim ends of reads)
	-minInd		0	(0 indicates no filtering)

Filedumping:
	-doDepth	0	(dump distribution of seqdepth)	.depthSample,.depthGlobal
	  -maxDepth	100	(bin together high depths)
	-doQsDist	0	(dump distribution of qscores)	.qs
	-dumpCounts	0
	  1: total seqdepth for site	.pos
	  2: seqdepth persample		.pos,.counts
	  3: A,C,G,T overall all samples	.pos,.counts
	  4: A,C,G,T for all samples	.pos,.counts
So if we wanted the sum of ACGTS across all samples we could write
./angsd -bam files.list -doCounts 1 -dumpCounts 3 -out tstCounts -nInd 10
---------------
head tstCounts.counts
totA	totC	totG	toft
0	0	1	0
0	1	0	0
1	0	0	0
1	0	0	0
2	0	0	0
0	0	0	2
0	0	0	2
0	0	0	2
0	0	2	0
Or if we wanted the sequencing depth per sample but only for the good quality data
./angsd -bam files.list -doCounts 1 -dumpCounts 2 -out tstCounts -nInd 10 -minQ 20 -minMapQ 30
---------------
head tstCounts.counts
ind0	ind1	ind2	ind3	ind4	ind5	ind6	ind7	ind8	ind9
0	0	0	0	0	0	0	0	0	0
0	0	0	0	0	0	0	0	1	0
0	0	0	0	0	0	0	0	1	0
0	0	0	0	0	0	0	0	1	0
0	0	0	0	0	0	0	0	1	0
0	0	0	0	0	0	0	0	1	0
0	0	0	0	0	0	0	0	1	0
0	0	0	0	0	0	0	0	1	0
0	0	0	0	0	0	0	0	1	0
Frequencies
We can also estimate the allele frequencies. This we do by using the -doMaf option.
./angsd -doMaf
analysisMaf.cpp:
-doMaf	0
	1: BFGS frequency (known major minor)
	2: EM frequency (known major minor)
	4: BFGS frequency (unknown major minor)
	8: EM frequency (unknown major minor)
	16: frequency from genotype probabilities
	32: alleleCounts based method (known major minor)
	-doSNP	0
	-minMaf	0.010000 0
	-minLRT	24.000000 0
	-ref	(null)
	-anc	(null)
	-doZ	0
	-eps	0.001000 [Only used for -doMaf &32]
So if we try to use -doMaf 2 angsd will complain!
./angsd0.530/angsd -bam files.list -doMaf 2 -out tstMaf
Error: you need to specify doMajorMinor in order to doMaf
So lets decide also estimate the major and minor, what are the options.
./angsd -doMajorMinor
-------------------
analysisMajorMinor.cpp:

	-doMajorMinor	0
	1: Infer major and minor from GL
	2: Infer major and minor from allele counts
	3: use major and minor from bim file (requires -filter afile.bim)
	4: Use reference allele as major (requires -ref)
	5: Use ancestral allele as major (requires -anc)
Let us infer the major and minor using the genotype likelihoods.
./angsd0.530/angsd -bam files.list -doMaf 2 -out tstMaf -doMajorMinor 1
-doMajorMinor 1 is based on genotype likelihoods, you must specify a genotype likelihood model -GL
So now we need to specify which genotype likelihood model we want to use, let us see what our options are
./angsd0.530/angsd -GL
---------------------
analysisEstLikes.cpp:
	-GL=0:
	1: SAMtools
	2: GATK
	3: SOAPsnp
	4: SYK
	-minQ		13		(remove bases with qscore<minQ)
	-trim		0		(zero means no trimming)
	-tmpdir		angsd_tmpdir/	(used by SOAPsnp)
	-errors		(null)		(used by SYK)
	-minInd		-1		(-1 indicates no filtering)

Filedumping:
	-doGlf	0
	1: binary glf (10 log likes)	.glf
	2: beagle likelihood file	.beagle.gz
	3: binary 3 times likelihood	.glf
	4: text version (10 log likes)	.glf
We pick the same model they use in samtools '-GL 1'.
./angsd0.530/angsd -bam files.list -doMaf 2 -out tstMaf -doMajorMinor 1 -GL 1 -nInd 20
head tstMaf.mafs
chromo	position	major	minor	knownEM	nInd
chr1	11782	G	A	0.000008	1
chr1	11783	C	A	0.000008	1
chr1	11784	A	C	0.000008	1
chr1	11785	A	C	0.000008	2
chr1	11786	A	C	0.000008	3
chr1	11787	T	A	0.000008	3
chr1	11788	T	A	0.000008	3
chr1	11789	T	A	0.000008	4
chr1	11790	G	A	0.000008	4
These sites are all invariable so lets filter out the sites with a maf below 0.5%
./angsd0.530/angsd -bam files.list -doMaf 2 -out tstMaf -doMajorMinor 1 -GL 1 -nInd 20 -minMaf 0.005 -nThreads 10
head tstMaf.mafs
chromo	position	major	minor	knownEM	nInd
chr1	13032	A	T	0.016541	9
chr1	13038	T	C	0.073424	9
chr1	13309	G	T	0.207854	4
chr1	13396	T	A	0.012727	16
chr1	13482	G	C	0.019104	15
chr1	13502	G	A	0.025732	14
chr1	13519	T	C	0.018256	17
chr1	14933	A	G	0.487768	1
chr1	16259	T	G	0.060360	7
The filters works across the different analysis classes, so if we supply the dumpCounts we will only get the sites with a maf >0.5%
./angsd0.530/angsd -bam files.list -doMaf 2 -out tstMaf -doMajorMinor 1 -GL 1 -nInd 20 -minMaf 0.005 -nThreads 10 -doCounts 1 -dumpCounts 3
paste tstMaf.pos tstMaf.counts |head
chr	pos	totDepth	totA	totC	totG	totT
chr1	13032	21	20	0	0	1
chr1	13038	21	0	1	0	20
chr1	13309	8	0	0	7	1
chr1	13396	34	1	0	0	33
chr1	13482	30	0	1	29	0
chr1	13502	25	1	0	24	0
chr1	13519	26	0	1	0	25
chr1	14933	2	1	0	1	0
chr1	16259	9	0	0	1	8
Estimating the SFS
We can also use angsd for estimating the site frequency spectrum.
./angsd0.530/angsd -realSFS
--------------
angsd_realSFS.cpp:
	-realSFS		0
	1: perform multisample GL estimation
	2: use an inbreeding version
	-doThetas		0 (calculate thetas)
	-underFlowProtect	0
	-fold			0 (deprecated)
	-anc			(null) (ancestral fasta)
	-noTrans		0 (remove transitions)
	-pest			(null) (prior SFS)
We have butterfly dataset for which we want to find the SFS.
So let us try to estimate the sfs
.angsd0.530/angsd -bam bom.bam -realSFS 1 -out testSFS
--------------
	-> angsd version: 0.529	 build(May  2 2013 14:09:03)
Must supply -anc for polarizing the spectrum
So we also need to supply a fasta which should contain our ancestral states. So lets do that.
./angsd0.530/angsd -bam bom.bam -realSFS 1 -out testSFS -anc bombyx/input/referenceseq.fasta -r ref_contig:-100000
--------------
Command:
angsd0.530/angsd -bam bom.bam -realSFS 1 -out testSFS -anc bombyx/input/referenceseq.fasta -r ref_contig:-100000
	-> angsd version: 0.529	 build(May  2 2013 14:09:03)
Must supply genotype likelihoods (-GL [INT])
So we also need to pick a genotype likelihood model
angsd0.530/angsd -bam bom.bam -realSFS 1 -out testSFS -anc bombyx/input/referenceseq.fasta -r ref_contig:-100000 -GL 1
--------------
	-> angsd version: 0.529	 build(May  2 2013 14:09:03)
[getFasta.cpp.init:24] bombyx/input/referenceseq.fasta
	->Starting analysis
[uppile] parsing 20 number of samples
region lookup 1/1
Change of chromo detected Waiting for nThreads:0
[magic] chaning to chr: 0
	->printing at chr: ref_contig pos:91269 chunknumber 100SEnding NULL this is a killswitch

	-> Done reading data waiting for calculations to finish
	-> Calling destroy
	-> Done waiting for threads
	->Output filenames:
		->"testSFS.arg"
		->"testSFS.sfs"
		->"testSFS.sfs.pos"

	Thu May  2 16:57:57 2013
	[ALL done] cpu-time used =  4.45 sec
	[ALL done] walltime used =  5.00 sec
We know use the external angsd program, for finding the MLE of the sfs
angsd0.552/misc/emOptim2
./emOptim2 afile.sfs nChr [-start FNAME -P nThreads -tole tole -maxIter  -nSites ]
nChr is the number of chromosomes. (twice the number of diploid invididuals)
we need to supply the binary .sfs file and the number of chromosomes.
./angsd0.552/misc/emOptim2 output/testSFS.sfs 40 -nSites 1000000 -P 2 >em.ml
[93] lik=-9788.890269 diff=0.00839985
[94] lik=-9788.882084 diff=0.0081856
[95] lik=-9788.874105 diff=0.00797879
[96] lik=-9788.866326 diff=0.00777909
[97] lik=-9788.858740 diff=0.0075862
[98] lik=-9788.851340 diff=0.00739982
[99] lik=-9788.844120 diff=0.00721969
likelihood: -9788.844120
</div>
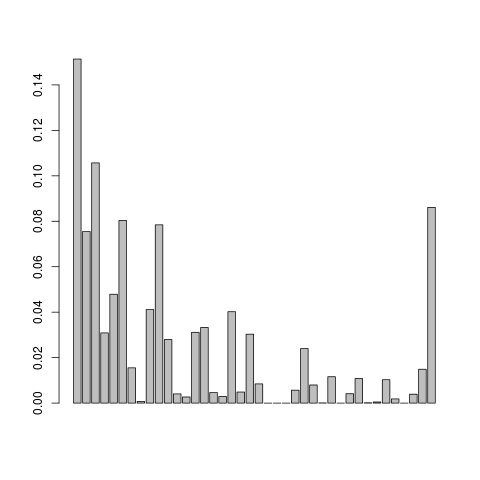
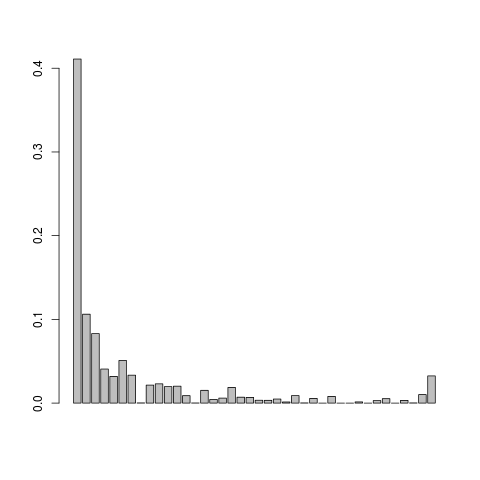
Let us visualise the em.ml file
This doesn't look so nice, we can try adjusting the mapping quality and do local realignment of the reads

